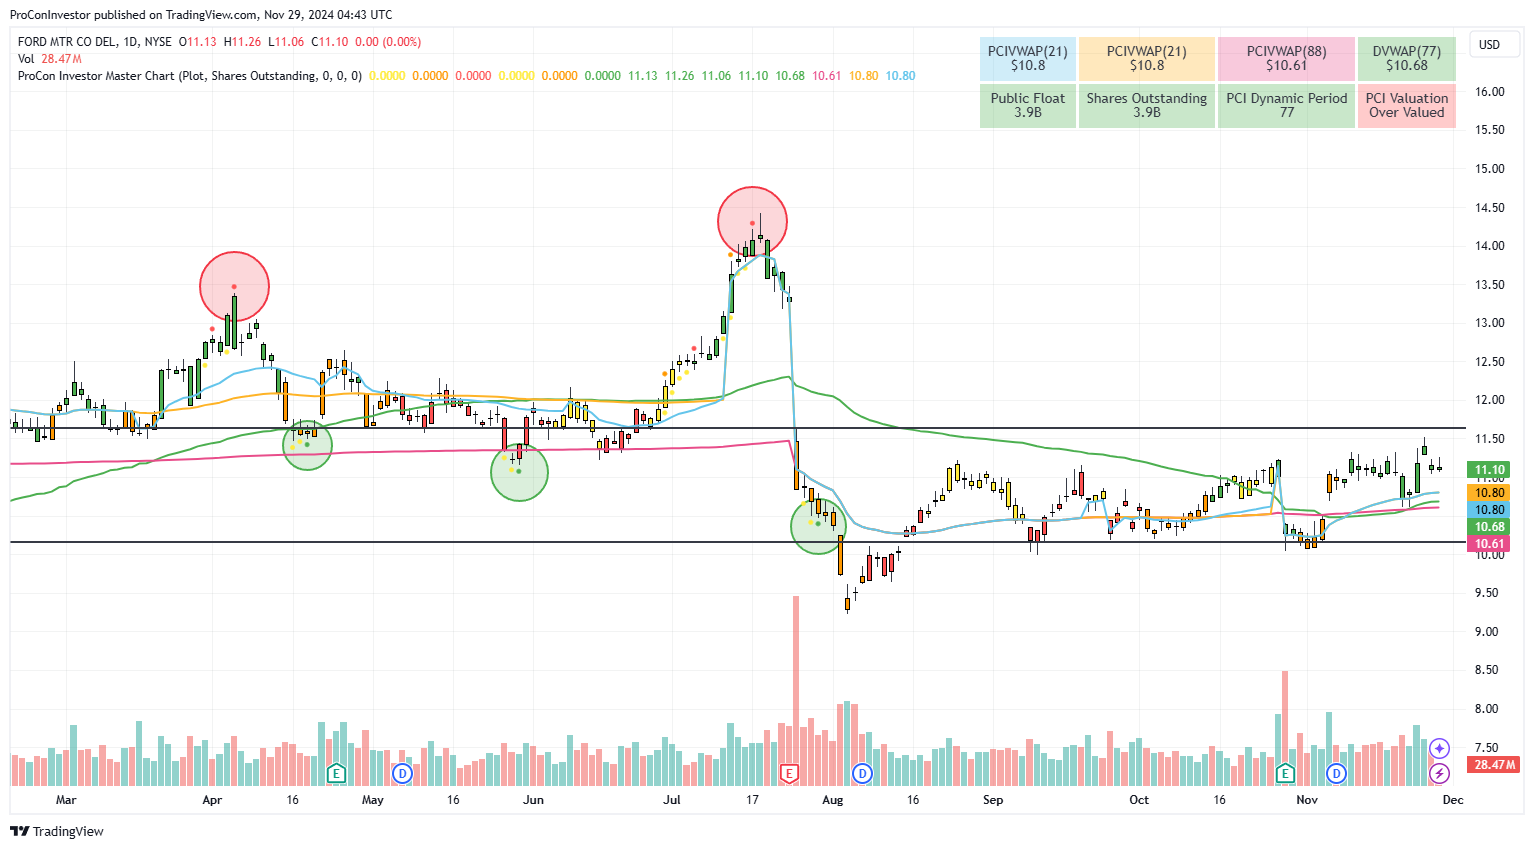
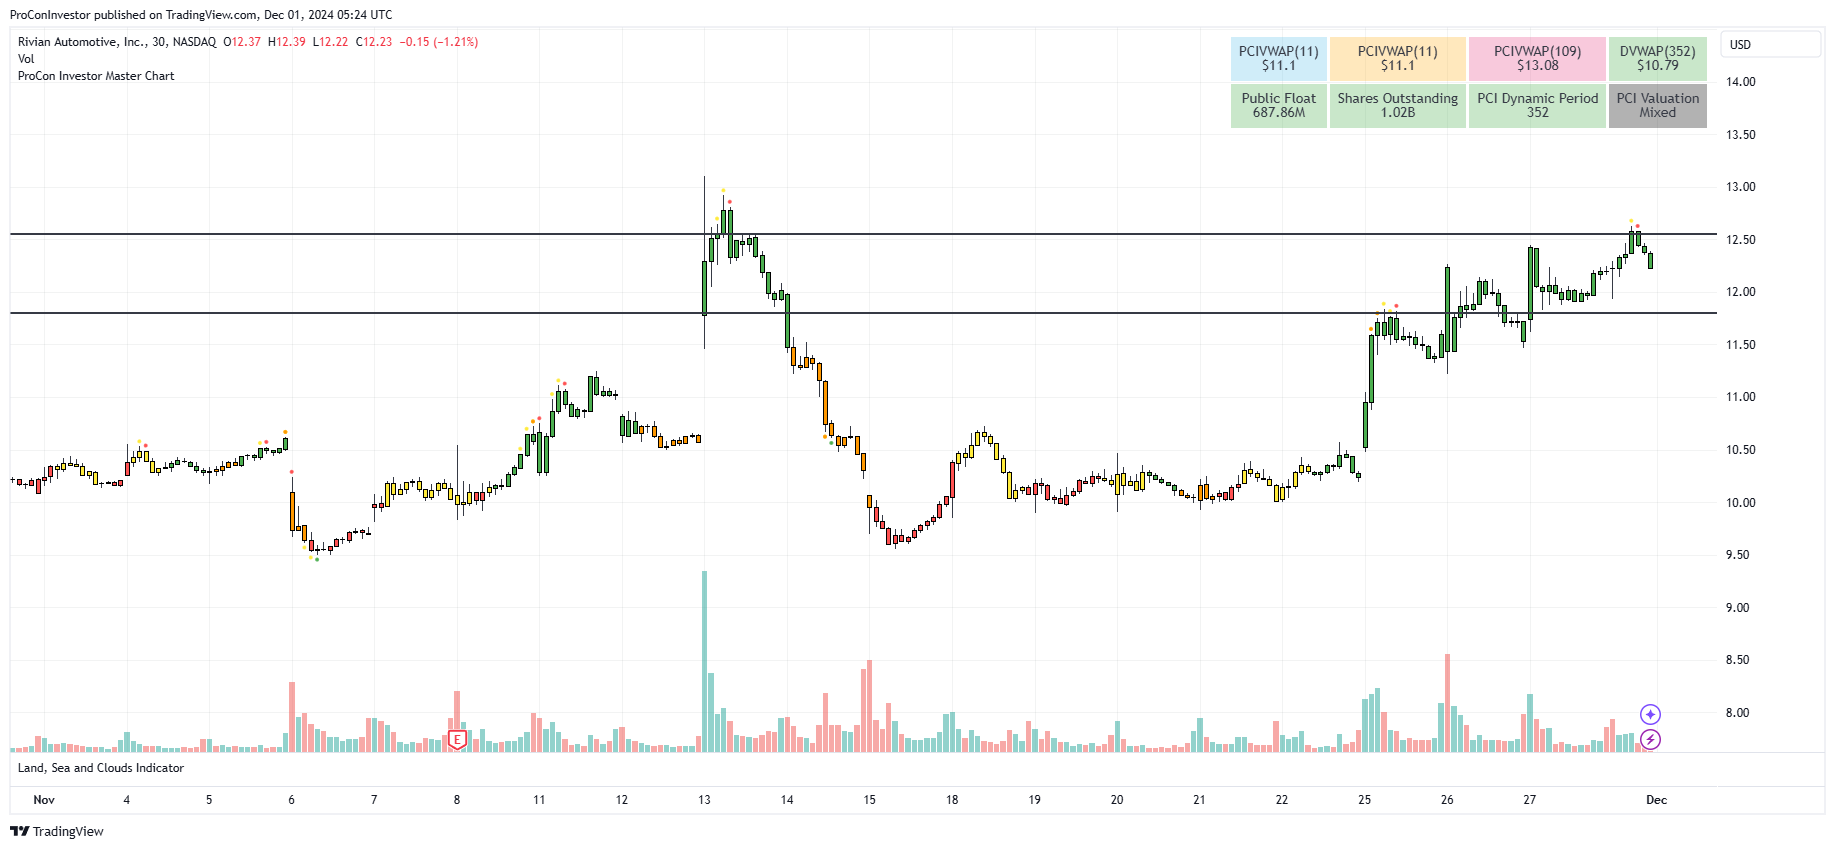
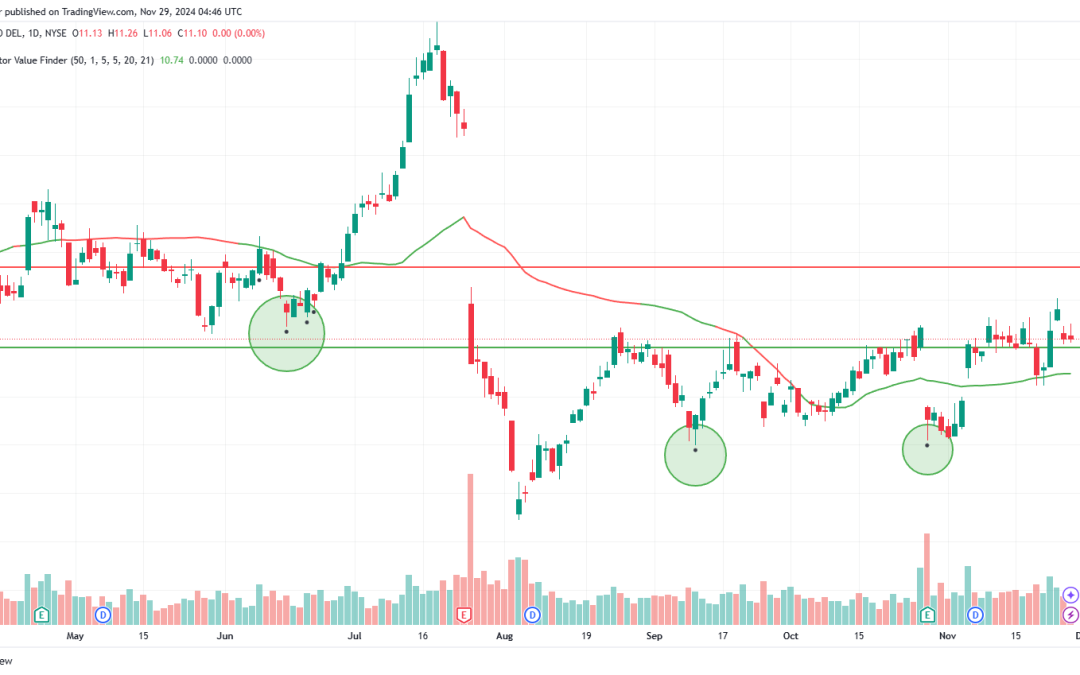
The ProCon Investor Master Chart is a powerful tool for traders and investors. By combining past and present data points into our proprietary algorithms, the indicator provides advanced market analytics with actionable insights. It integrates dynamic VWAP calculations, sentiment analysis, and proprietary support/resistance metrics to offer a comprehensive view of market conditions. Whether managing large positions or identifying high-potential setups, this indicator provides the data needed to make informed decisions.
Key Features:
- VWAP Calculation:
- Adapts dynamically to trading volumes and shares outstanding or float, with custom configuration options.
- Trend-Based Candle Coloring:
- Visualizes trends with automatic candlestick coloring based on SMA, EMA, and trend indicators.
- High Volume Analysis:
- Tracks high-volume activity over multiple periods to identify breakout zones and market activity.
- Dynamic Support and Resistance Levels:
- Automatically plots critical support and resistance levels using Bollinger Bands, VWAP, and volume metrics.
- Sentiment Analysis:
- Categorizes assets as undervalued, overvalued, or mixed based on their VWAP relationships.
- Customizable Visualization:
- Offers multiple visualization modes and a performance table summarizing key metrics.
- Traditional Indicators Re-Imagined.
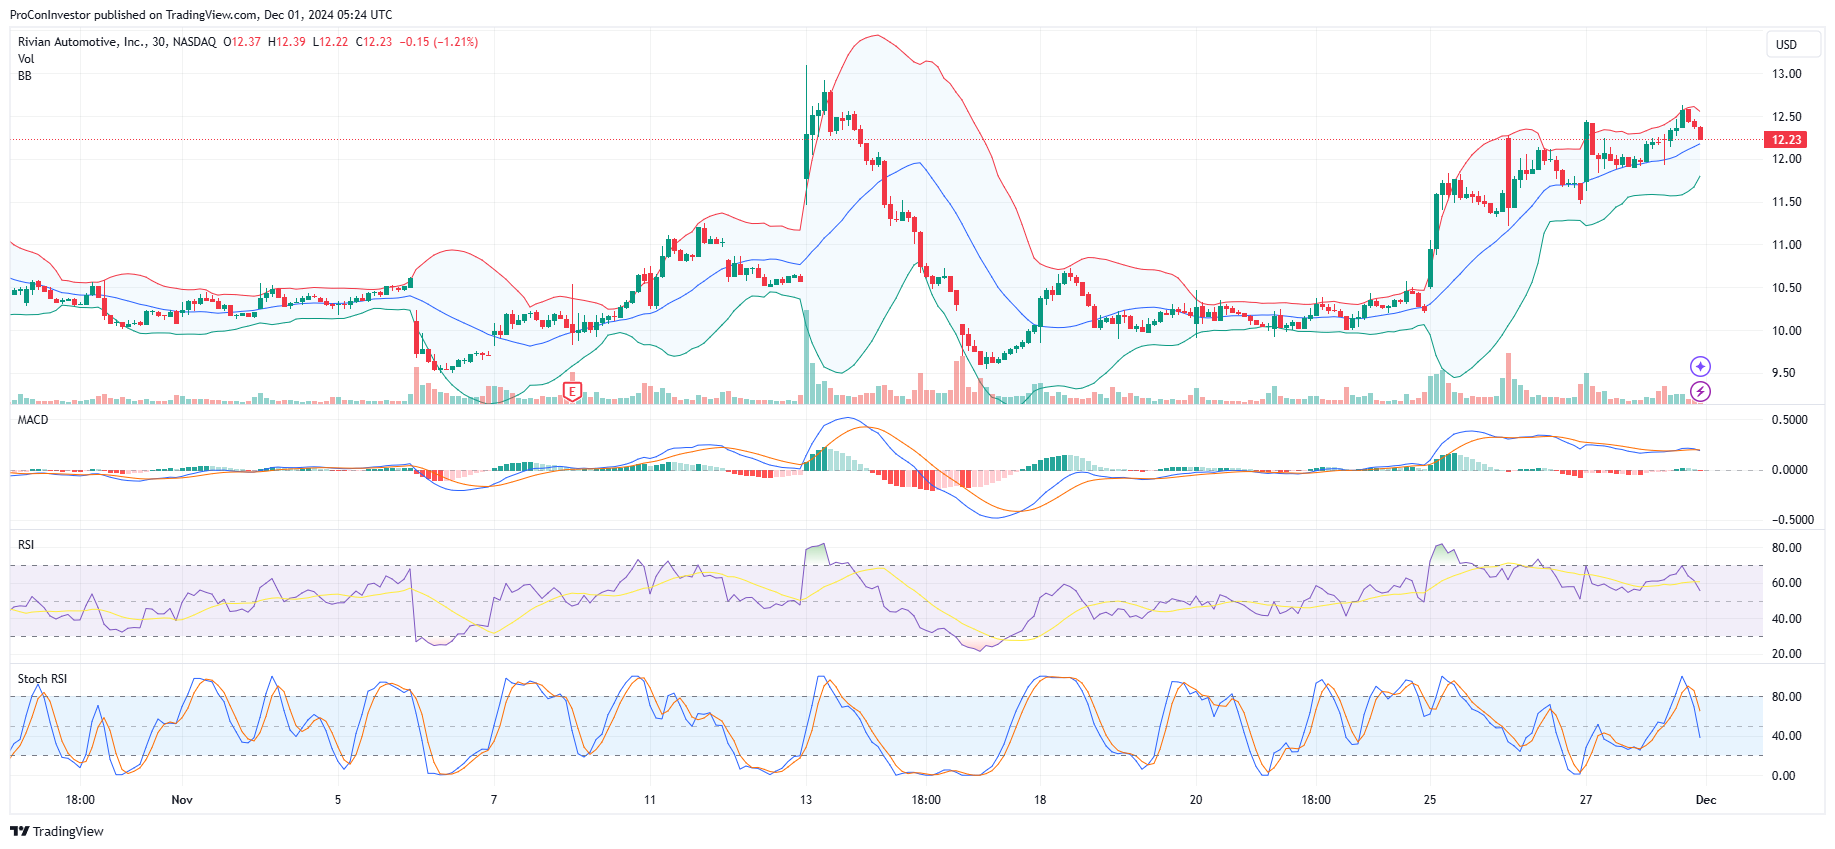
- By combining past and present values for RSI, MACD, stochastic oscillators, and Bollinger Bands, the indicator generates unique conditions for overbought/oversold detection.
Benefits for Traders:
- Enhanced market understanding through a multidimensional analysis of price action and volume.
- Improved trend detection and sentiment analysis for better decision-making.
- Customizable settings for various trading strategies, from short squeezes to long-term trend following.
Who Should Use This Indicator?
- Day Traders: Identify trends and breakouts quickly.
- Swing Traders: Align trades with sentiment and support/resistance levels.
- Value Investors: Identify undervalued opportunities.
- Short Sellers: Analyze short squeeze potential effectively.
Why It Stands Out:
The ProCon Investor Master Chart integrates trend detection, volume analytics, and sentiment analysis into a single, cohesive tool. Its ability to adapt to different market conditions and strategies makes it a versatile solution for serious traders and investors.


